1/17


ONE i3™ Near Me™
1K+ダウンロード
8MBサイズ
1.1.7 (74287)(06-11-2021)最新バージョン
詳細レビューバージョン情報
1/17
ONE i3™ Near Me™の説明
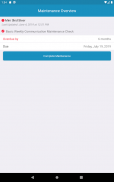
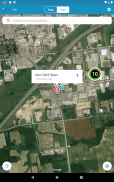
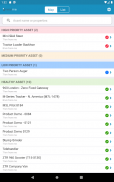
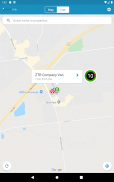
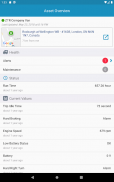
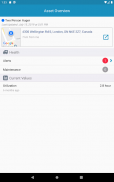
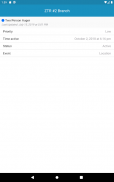
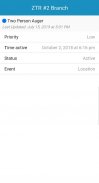
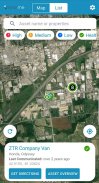
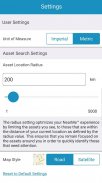
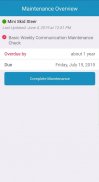
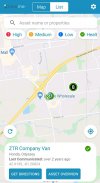
ONE i3™Near Me™は、外出先やフィールドで産業機器を管理および保守するための強力なアプリです。周囲の資産のステータスと場所を表示し、注意が必要な資産をすばやく特定します。資産データ、アラート、障害、メンテナンスの詳細にアクセスして、リアルタイムで応答し、車両を稼働させます。
ONE i3™Near Me™には、ONE i3™プラットフォームで有効化されたテレマティクスサービスが必要です。詳細については、ONE i3™管理者にお問い合わせください。
ONE i3™ Near Me™ - バージョン 1.1.7 (74287)
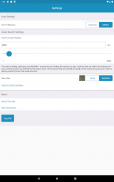
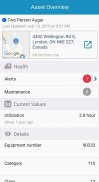
(06-11-2021)新機能は* Added Time-Series data visualization to the Asset Overview screen:* Time-Series data visually displays equipment asset data (real-time and historical information) using a line graph. Allowing you to analyze trends quickly, view anomalies and visually track asset changes (e.g., battery, engine status, etc.) over time.* Improvements to the map’s functionality:* Near me, functional improvements and performance enhancements to improve the user experience.
ONE i3™ Near Me™- APK情報
APKバージョン: 1.1.7 (74287)パッケージ: com.ztr.nearme.android名前: ONE i3™ Near Me™サイズ: 8 MBダウンロード: 0バージョン : 1.1.7 (74287)リリース日: 2024-06-05 23:48:54最小スクリーン: SMALLサポートされたCPU:
パッケージ ID: com.ztr.nearme.androidSHA1署名: 47:98:41:08:F1:A2:AA:21:88:9B:6B:94:AB:1E:C7:FD:16:BE:F5:9F開発者 (CN): ESD DEV組織 (O): ZTR地域 (L): London国 (C): CA都道府県/州/市 (ST): Ontarioパッケージ ID: com.ztr.nearme.androidSHA1署名: 47:98:41:08:F1:A2:AA:21:88:9B:6B:94:AB:1E:C7:FD:16:BE:F5:9F開発者 (CN): ESD DEV組織 (O): ZTR地域 (L): London国 (C): CA都道府県/州/市 (ST): Ontario
ONE i3™ Near Me™の最新バージョン
1.1.7 (74287)
6/11/20210 ダウンロード7.5 MB サイズ
他のバージョン
1.1.5 (71997)
1/10/20210 ダウンロード7.5 MB サイズ
1.1.3 (67996)
19/8/20210 ダウンロード7.5 MB サイズ
1.1.2 (42218)
16/8/20200 ダウンロード6.5 MB サイズ
1.0.0 (30900)
7/8/20200 ダウンロード6 MB サイズ


同じカテゴリのアプリ

その他のおすすめ...

English


